
Before EzyMap. After EzyMap.
Same chart. Same market. Two very different states of mind.
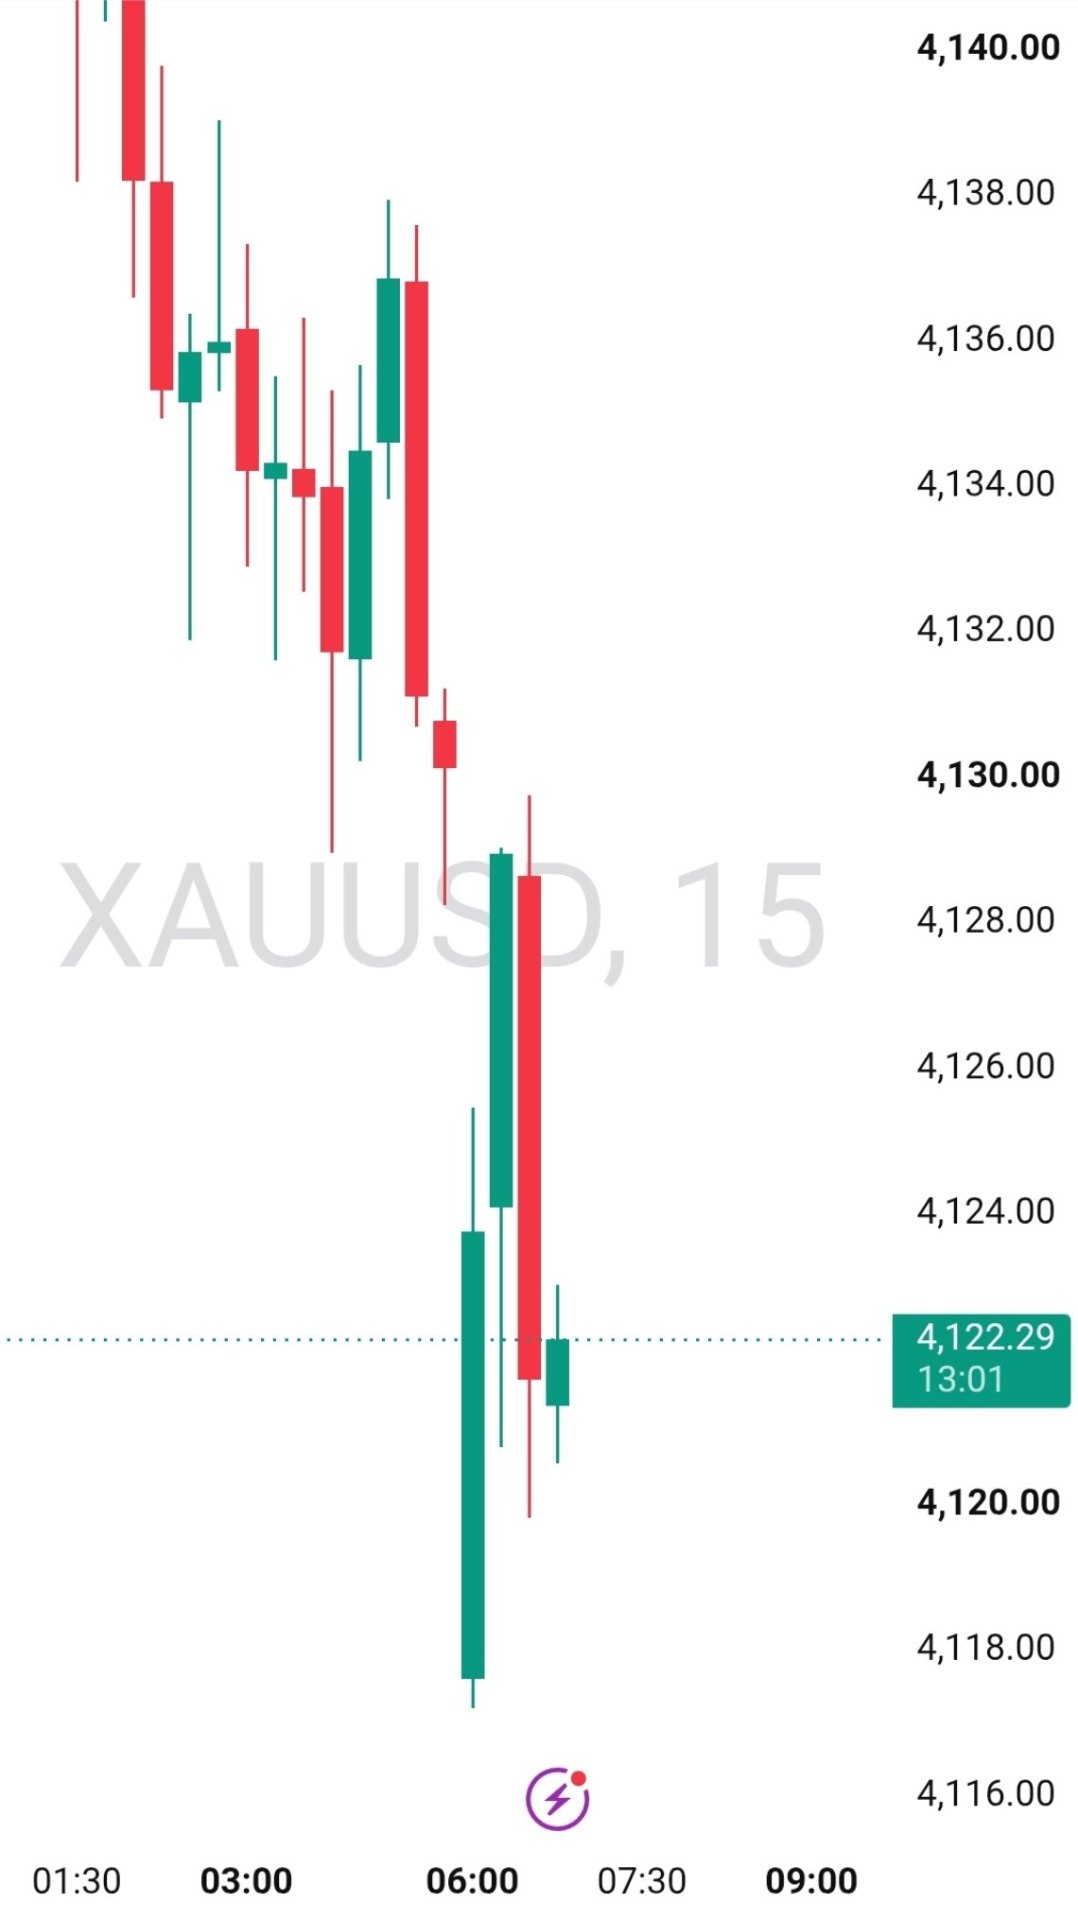
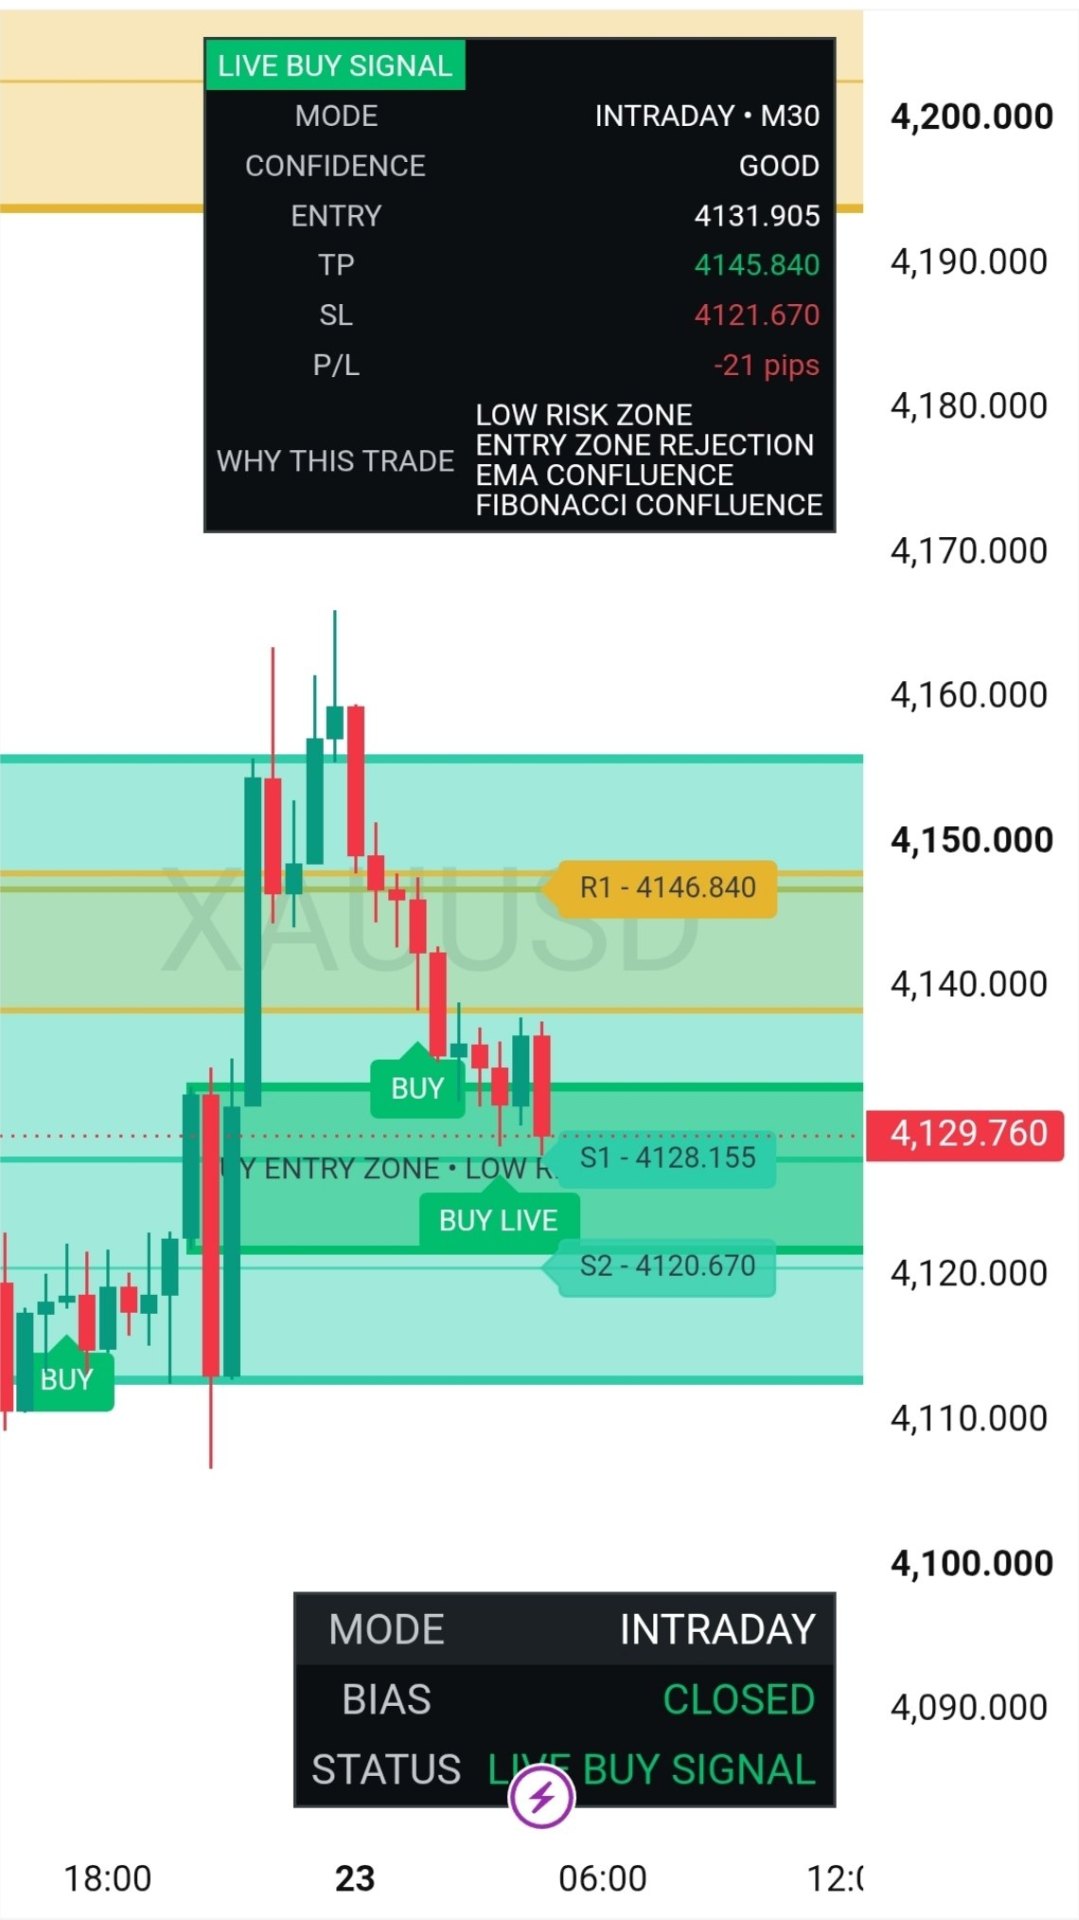
Wins. Losses. No-entries too.
We publish the misses along with the winners. A trading system that only shows greens is a marketing funnel, not an edge.
Low-risk buy zone, EMA + Fibonacci confluence. LIVE alert fired at 4,131.90.
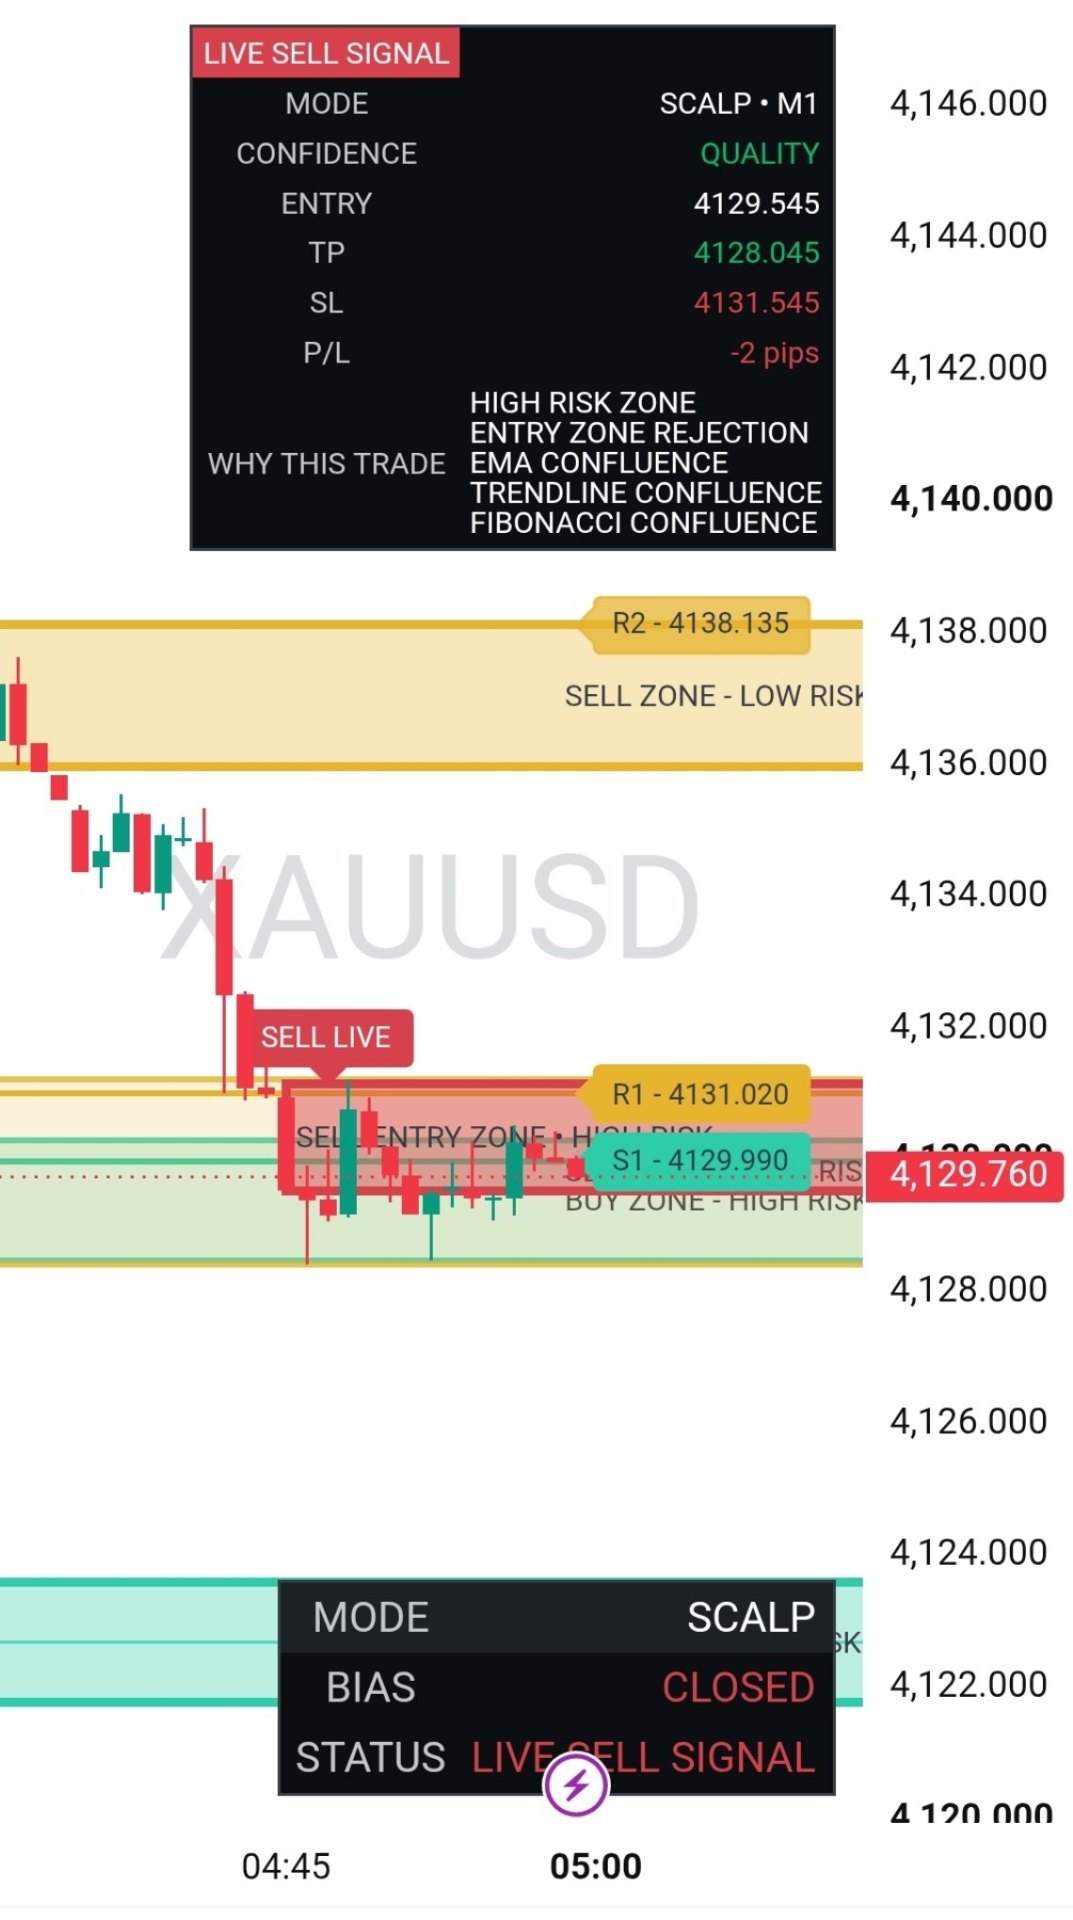
High-risk zone rejection, plan hit stop on wick. Sized small, damage minimal.
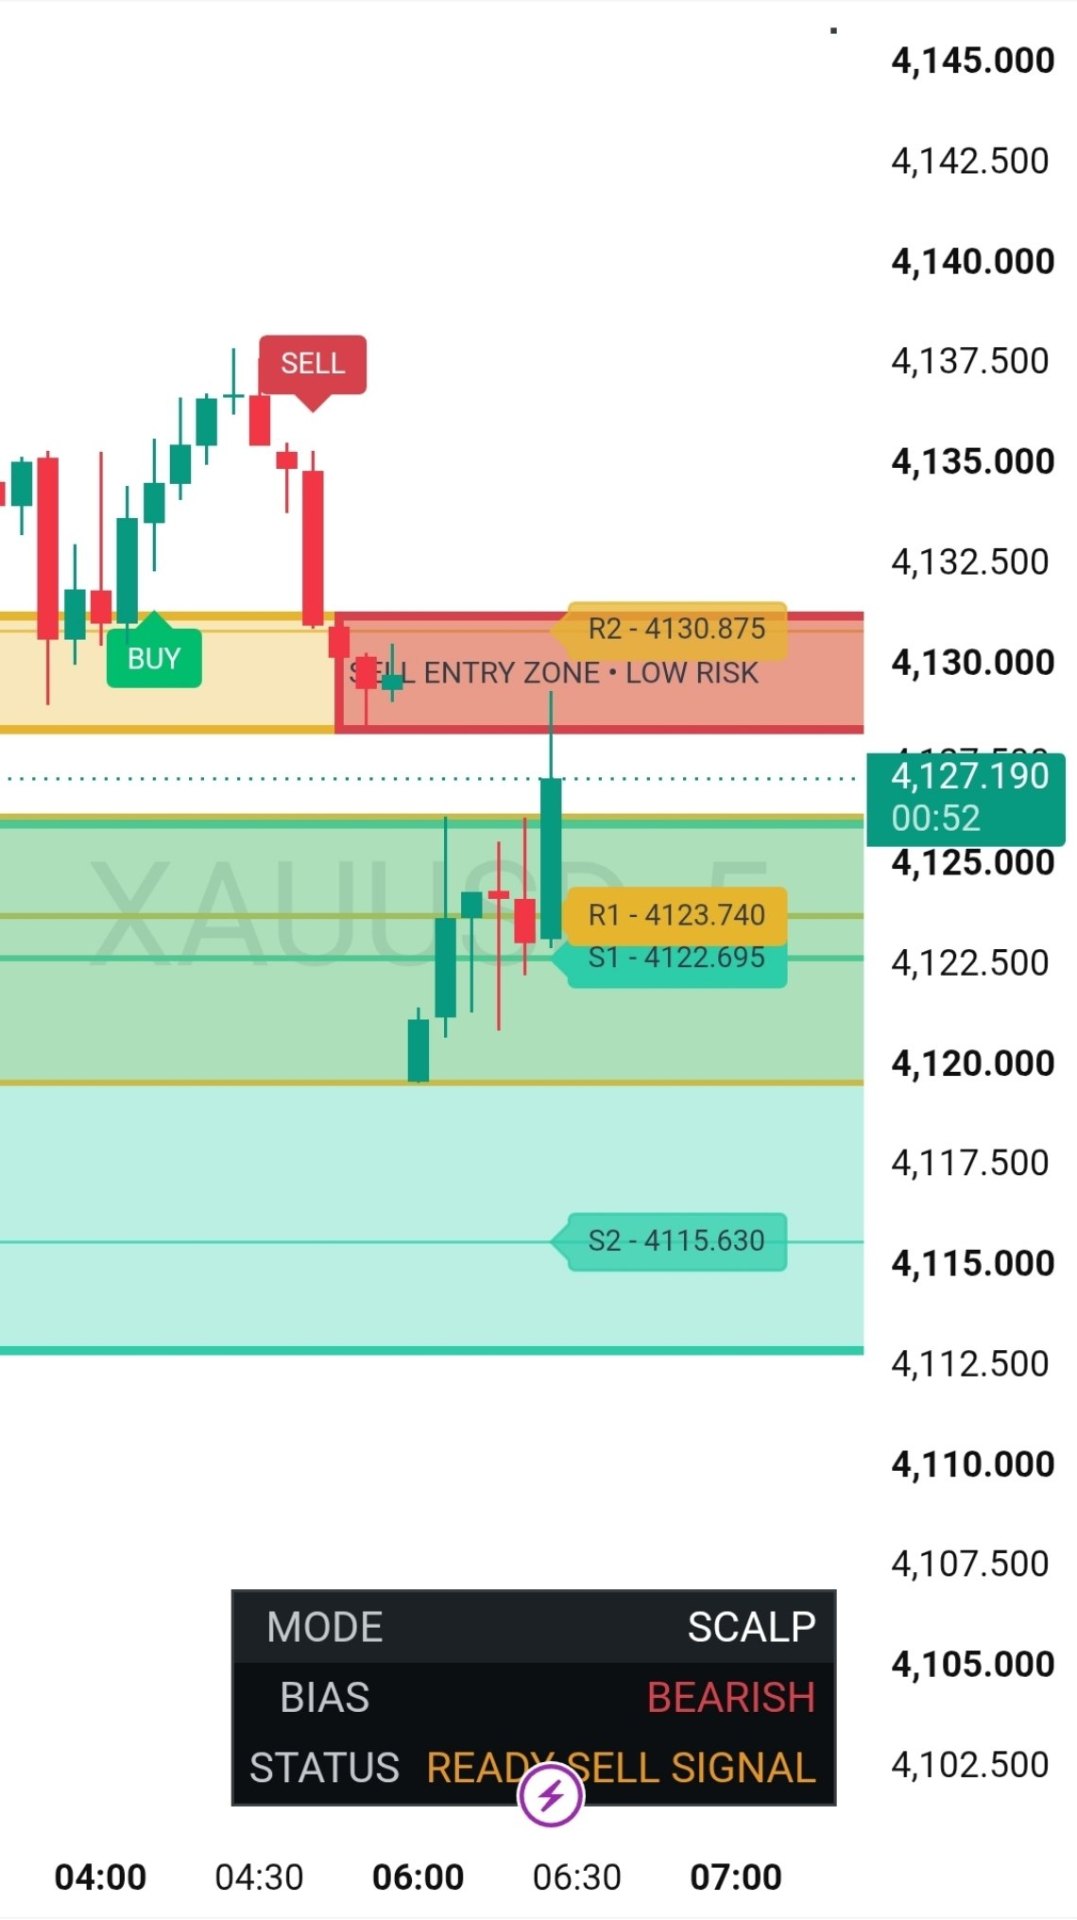
Sell zone mapped at 4,130 — waiting for price to tap. Discipline > FOMO.
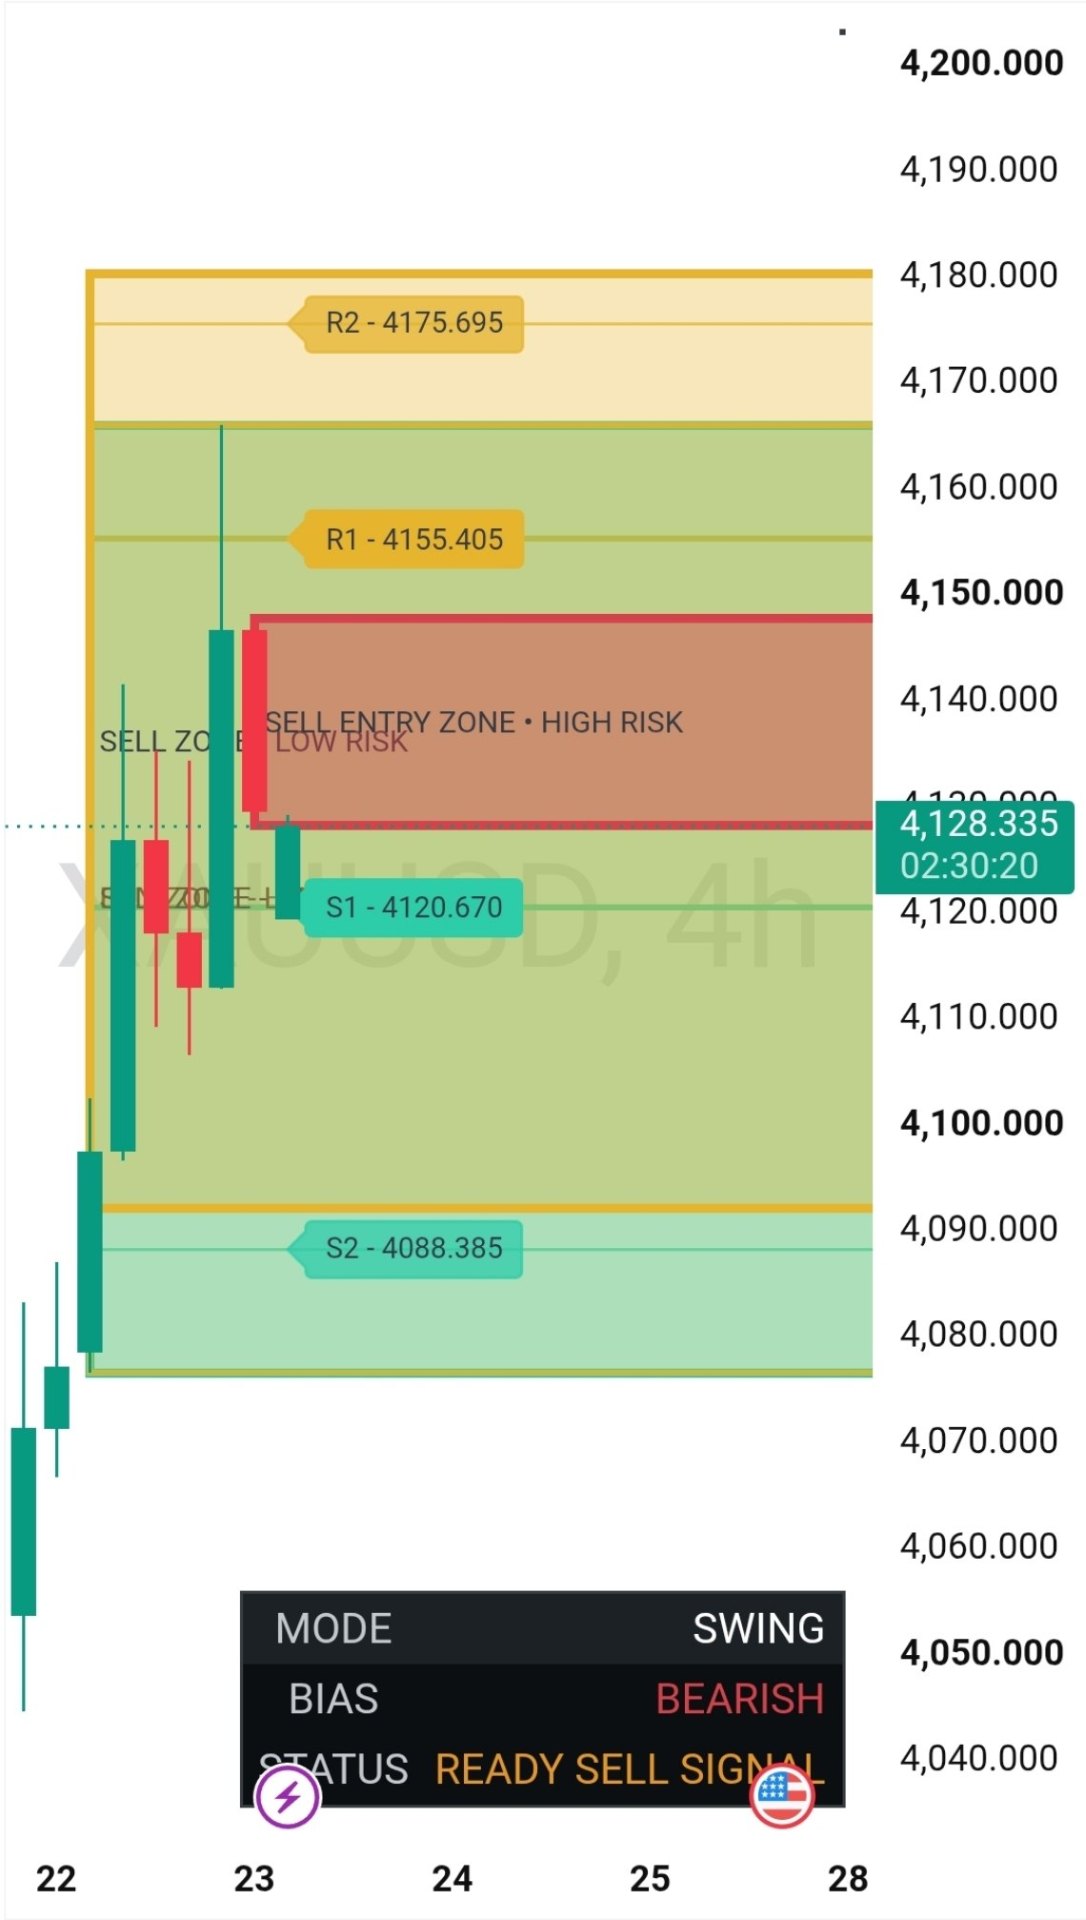
Bearish bias, sell entry zone mapped above 4,128. Plan waits for the market.
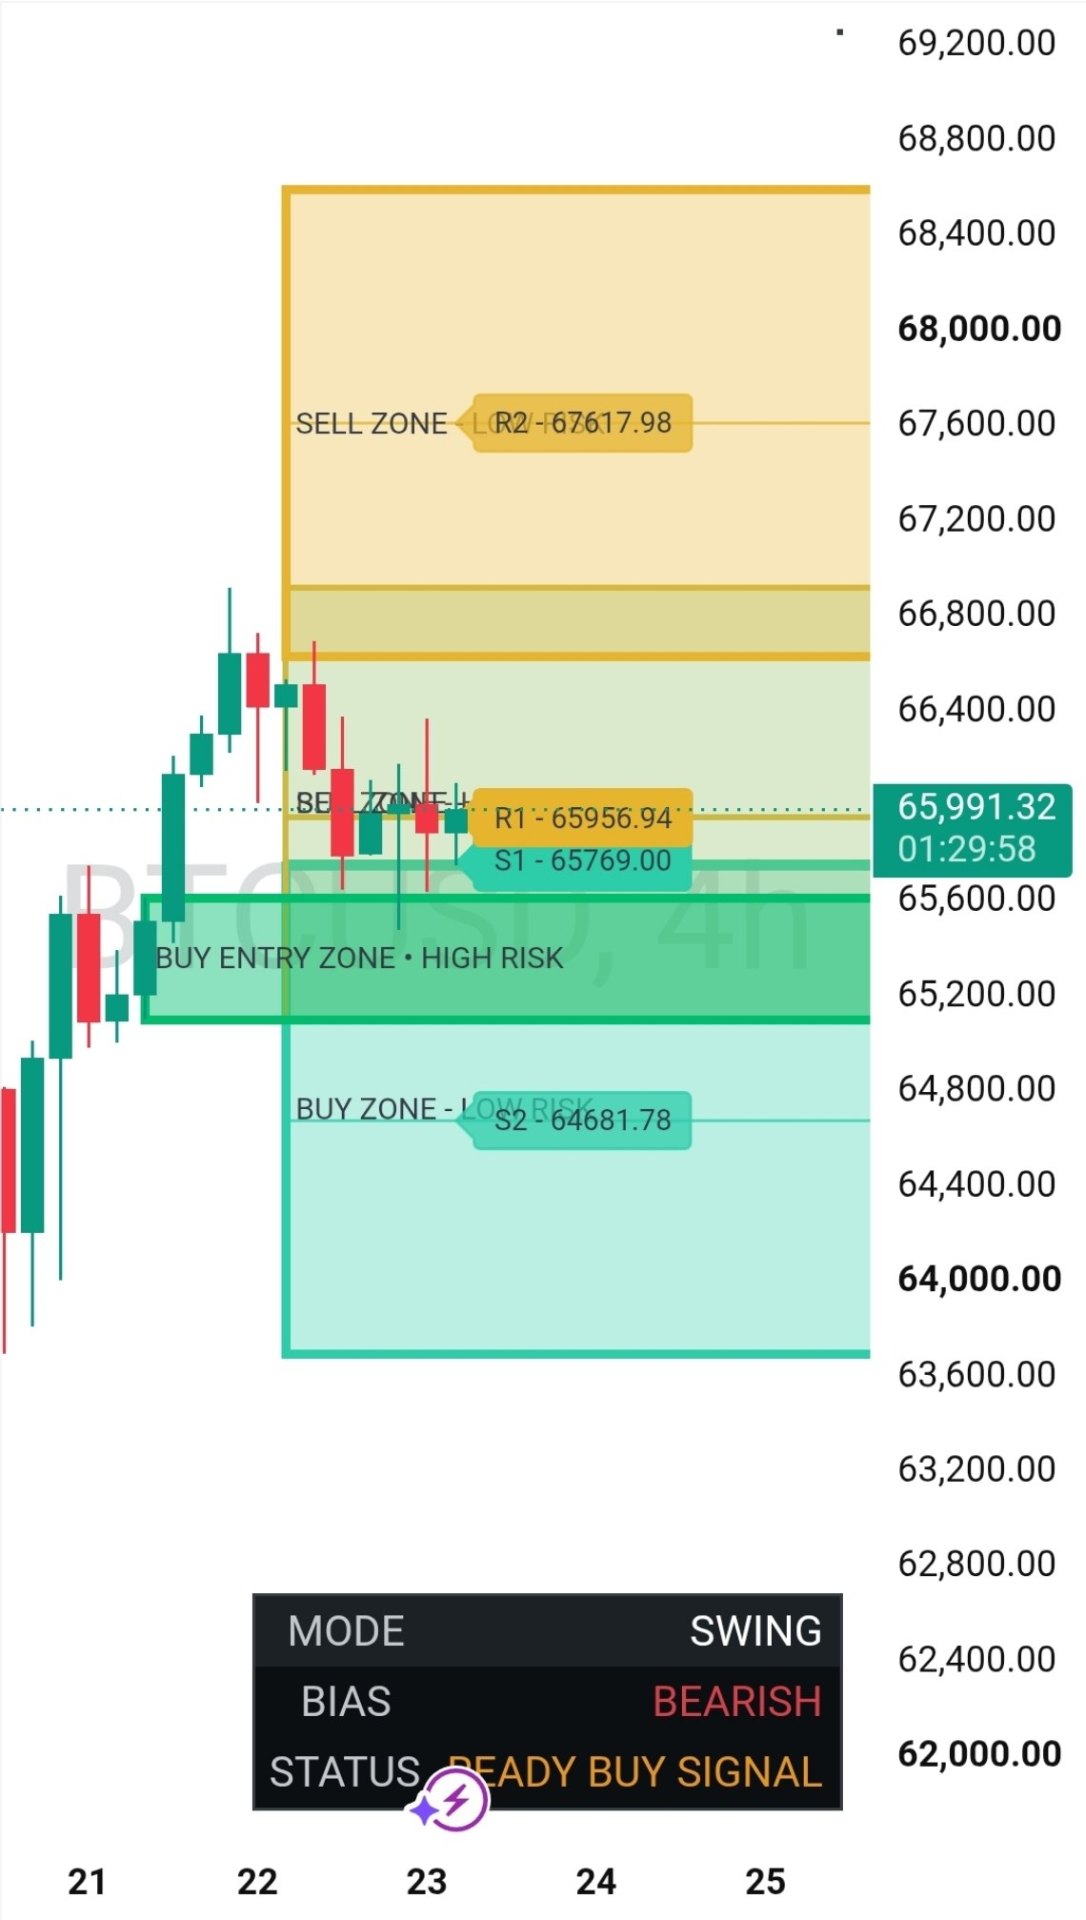
Bearish short-term bias, low-risk buy zone mapped below 65,600. Ready state.
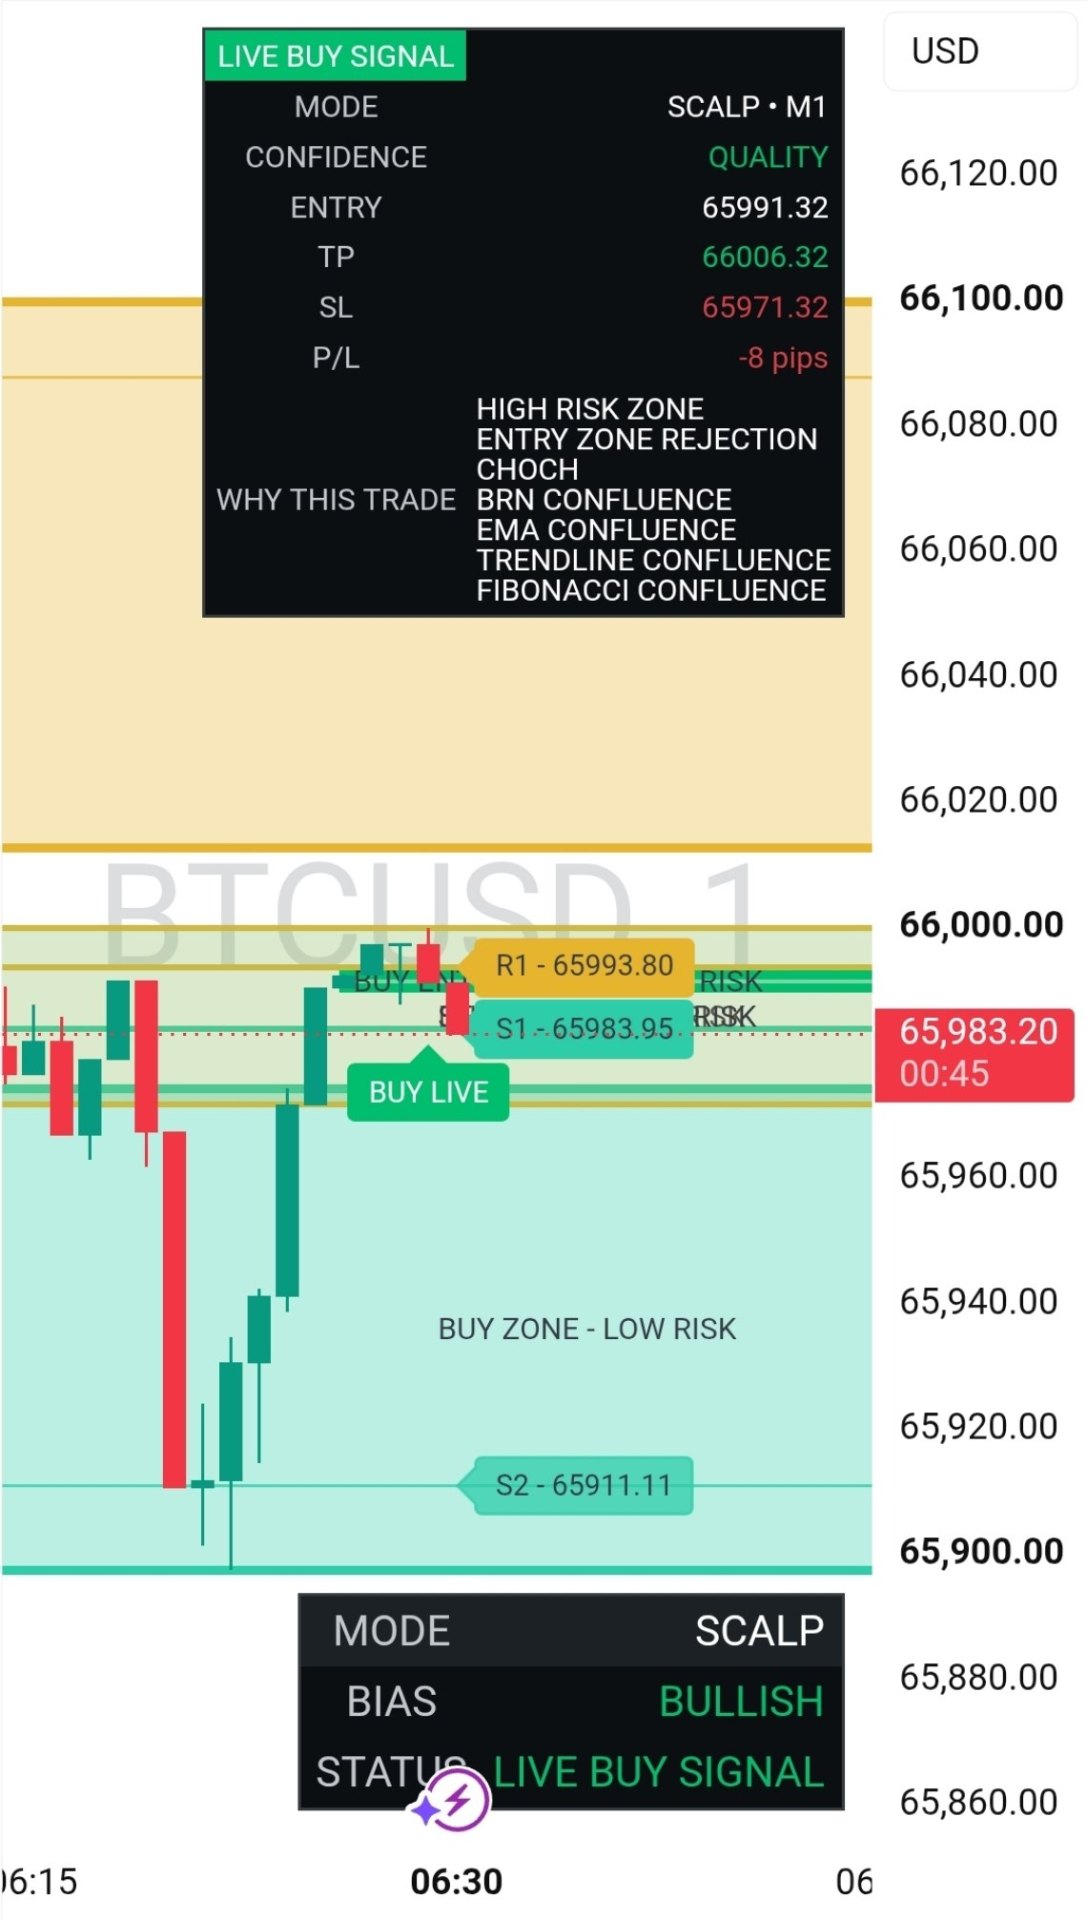
Entry zone rejection with CHoCH confluence. Stop hit on retest. Same map, next print.
Historical setups are shown for education. Past performance does not indicate future results. Trade at your own risk.