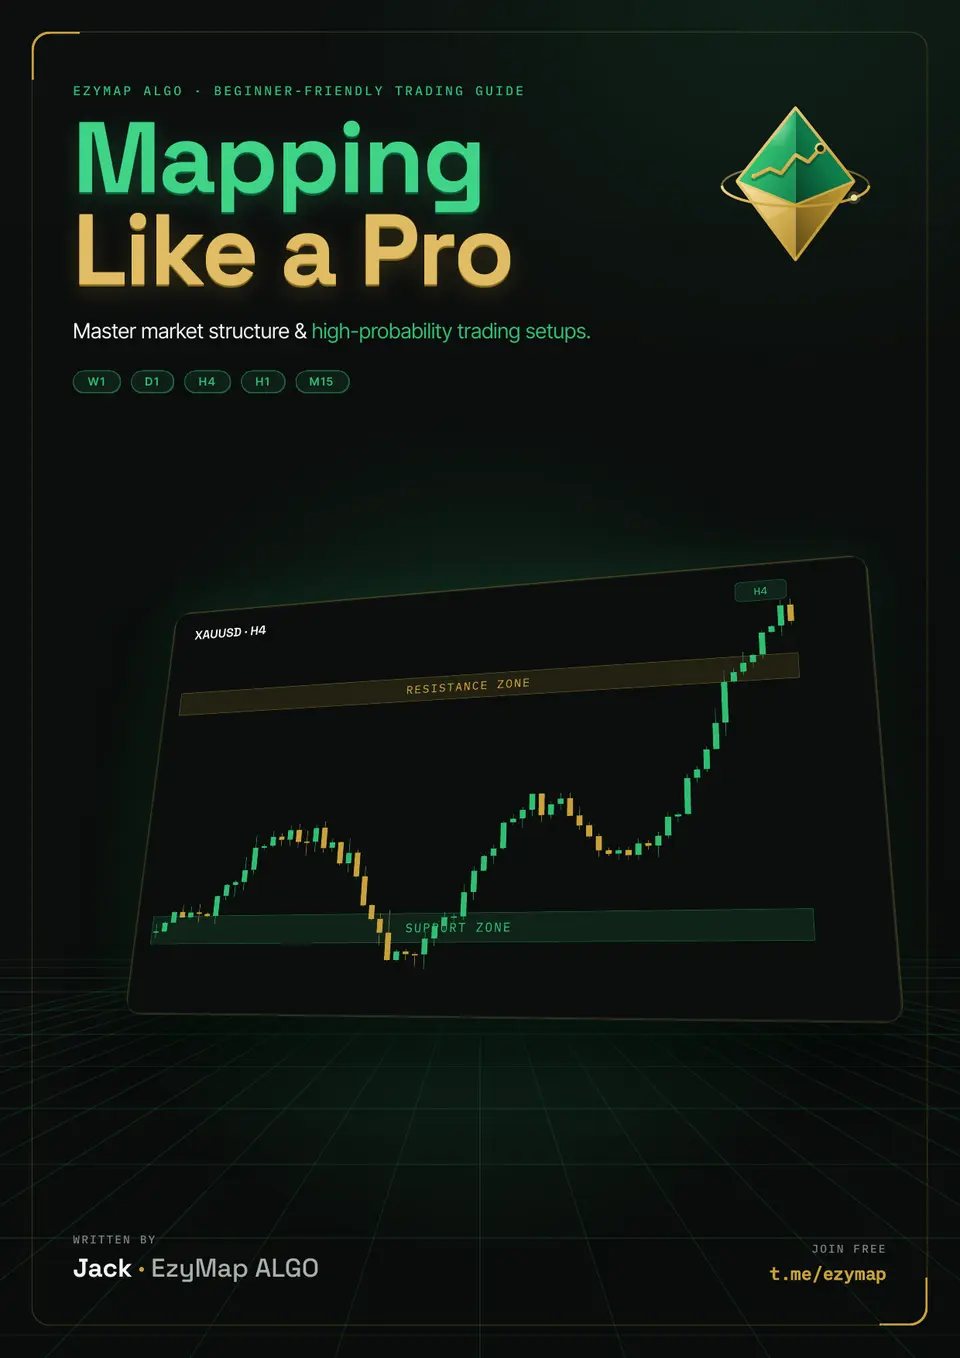
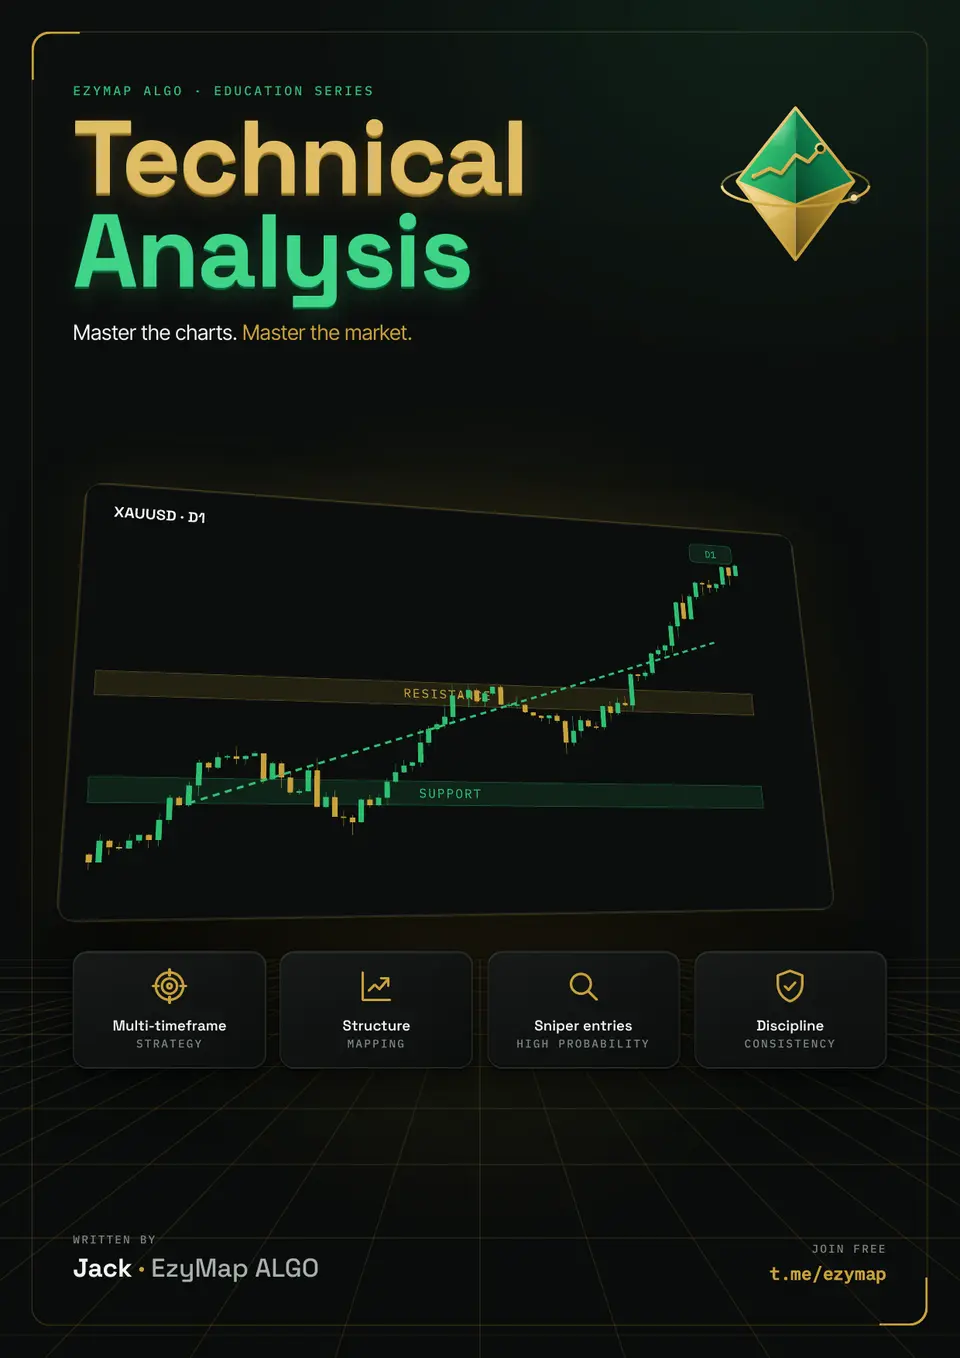
Technical Analysis Ebook
Support & resistance, trendlines, chart patterns and candlesticks — the core toolkit, no fluff.
The four building blocks every trader uses to read a chart before taking a trade: where price is likely to react, how to draw the lines that matter, the patterns that repeat, and what a single candle is telling you.
14 页 · PDF 10 min read快速登录即可免费获取 — 即时下载
适合你,如果
- You want the core chart-reading toolkit in one short guide
- You're just starting with support/resistance, trendlines and candles
- You'd rather see the essentials than wade through ten strategies
你将能够做到
Spot support and resistance zones and know how traders actually use them
Draw trendlines correctly and read what their angle and breaks mean
Recognise the key reversal and continuation chart patterns
Read single and multi-candle patterns like doji, engulfing and morning/evening star
指南内容
- 01
Why use technical analysis
Charting the patterns and trends before you take a trade.
- 02
Support & resistance
Where buyers and sellers take over, and how levels flip once broken.
- 03
Trendlines
How to draw them, read their angle, and what a break signals.
- 04
Chart patterns
Reversal patterns (head & shoulders, double top/bottom, wedges) and continuation patterns (flags, triangles).
- 05
Candlestick patterns
Single-candle signals (doji, hammer, marubozu) and multi-candle signals (engulfing, morning/evening star, three soldiers/crows).